
One of the recurring requests we receive from our customers is the need for more executive-level views inside Prominence AI. As the volume of data grows and the range of metrics expands, teams want ways to interpret insights faster, compare segments more easily and reduce the time spent navigating detailed dashboards. This feedback reflects a broader shift in how brands are approaching GEO: less time digging through data, more time making decisions.
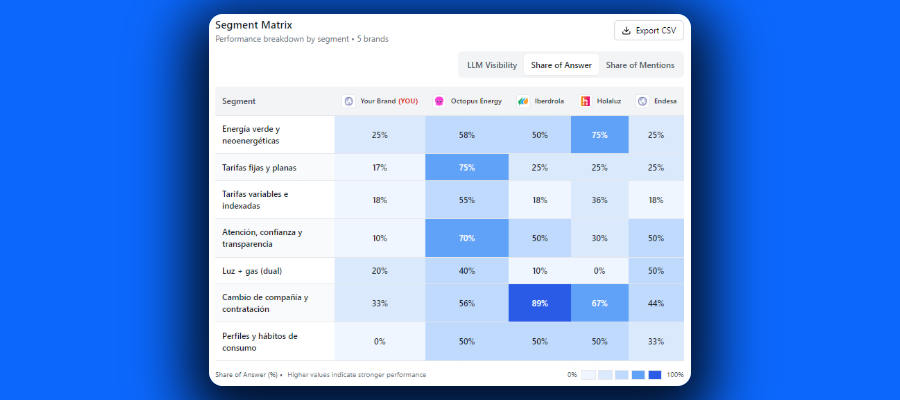
Today, we are introducing Segment Matrix, a new functionality designed precisely for that purpose. Built from direct customer input, it provides a high-level, aggregated view of performance across your configured segments and competitors, allowing users to see the big picture in seconds rather than minutes.
segment-matrix
A solution shaped directly by customer feedback
Prominence has always been shaped by a simple principle: build what customers actually need. Over the past months, many teams told us the same thing. While our dashboards provide deep visibility into prompts, models and competitive performance, they wanted a complementary view that could surface segment-level insights instantly.
Teams asked for:
a clearer way to compare segments against competitors,
a simplified view to share internally with leadership,
a faster way to identify where visibility is strong or weak,
and a more executive output that summarises performance at a glance.
Segment Matrix was born from that feedback. It encapsulates the performance of each configured segment inside a single visual, reducing the need to navigate multiple sections or manually stitch data together.
How Segment Matrix works
Each customer configures their own segments inside Prominence, grouping prompts into themes, categories or strategic territories. Segment Matrix takes those segments and displays them in a clean, structured matrix.
Rows (Y-axis): the customer’s configured segments
Columns: the brands included via the Brand Selector
Values: aggregated visibility metrics for each segment-brand combination (SOA, SOM, LLMVI), adjusted by the dashboard’s time frame and model filters
This means you can immediately answer questions such as:
How do we perform across our core segments compared to competitors?
Which segment presents the strongest visibility opportunities?
Where do competitors over-index, and where do we lead?
Which segments require deeper analysis, and which already show strong performance?
The view adapts dynamically based on your brand selection, the timeframe you choose and the models you analyse. This allows teams to produce fully customised segment performance reports in just a few clicks.
Segment Matrix is more than a visual enhancement
It fundamentally changes how quickly teams can move from insight to action.
1. Faster analysis, reduced complexity
Instead of navigating multiple sections of the dashboard, segment performance can now be reviewed in a single, consolidated view. For many teams, this replaces manual cross-analysis that previously required much more time.
2. Executive clarity for decision-makers
The matrix serves as a direct input for leadership conversations. It summarises performance in a way that is immediately understandable, making it ideal for reporting, presentations and strategic discussions.
3. Better identification of segment-level opportunities
Because metrics are aggregated, patterns emerge quickly: strengths, weaknesses, competitive gaps and areas requiring deeper exploration.
4. Fully adaptable to each brand’s competitive reality
Thanks to the Brand Selector, teams can tailor the view to the competitors that matter most in each moment, generating customised reports without additional work.
Built for speed, clarity and decision-making
Segment Matrix is the latest step in our commitment to making Prominence AI a powerful, adaptable and genuinely useful tool for AI search measurement. As GEO becomes a core part of the marketing mix, teams need fast, accurate and executive-friendly analyses that reflect how brands perform across segments and models.
And of course, this is only the beginning. We will continue evolving our solution based on the needs and feedback of our customers, with more features already in development that will further enhance understanding, speed and usability.